Synthetic Monitoring
Clever Clicking
Alyvix is an open source APM tool for synthetic monitoring
Eyes and hands like a human
With a stopwatch. And tireless.
Build end-user AI bots. Alyvix visually interacts with any Windows application like ERPs, CRMs or web browsers. Run and measure your business-critical workflows like a human would, but continuously.
Measure the end-user experience. Alyvix records the click-to-appearance responsiveness of each interactive step in your workflow. Create reports on IT service quality to support technical and business decisions.
Visually define end-user workflows: Use Alyvix Editor to build synthetic test cases for your applications, step by interactive step, in your GUI
Automate any GUI-based (even streamed) Windows application: Alyvix works by processing screen frames, it doesn't need a special API for each application
Run visual, synthetic test cases that interact with your favorite app: Alyvix moves the mouse and types with the keyboard just like a person does
Measure transaction time click-to-appearance: Alyvix measures how long it takes each workflow step to complete after the previous one
Record the availability and responsiveness of each transaction: With Alyvix you can monitor the performance of end-user experiences
Alyvix provides annotated screenshots as demonstrable and indisputable proof whenever an expected workflow response times out
Visual Transaction Definition
The first stage of automating end-user workflows is to visually define each step in your workflow, and Alyvix Editor gives you all the tools you need. Just point and click to select GUI components from an application's window, then use them to create the task steps in your Alyvix test case. For each component you can choose a type (image, rectangle or text), any actions needed (mouse and keyboard) and its click-to-appearance time thresholds (warning, critical and timeout for IT monitoring).
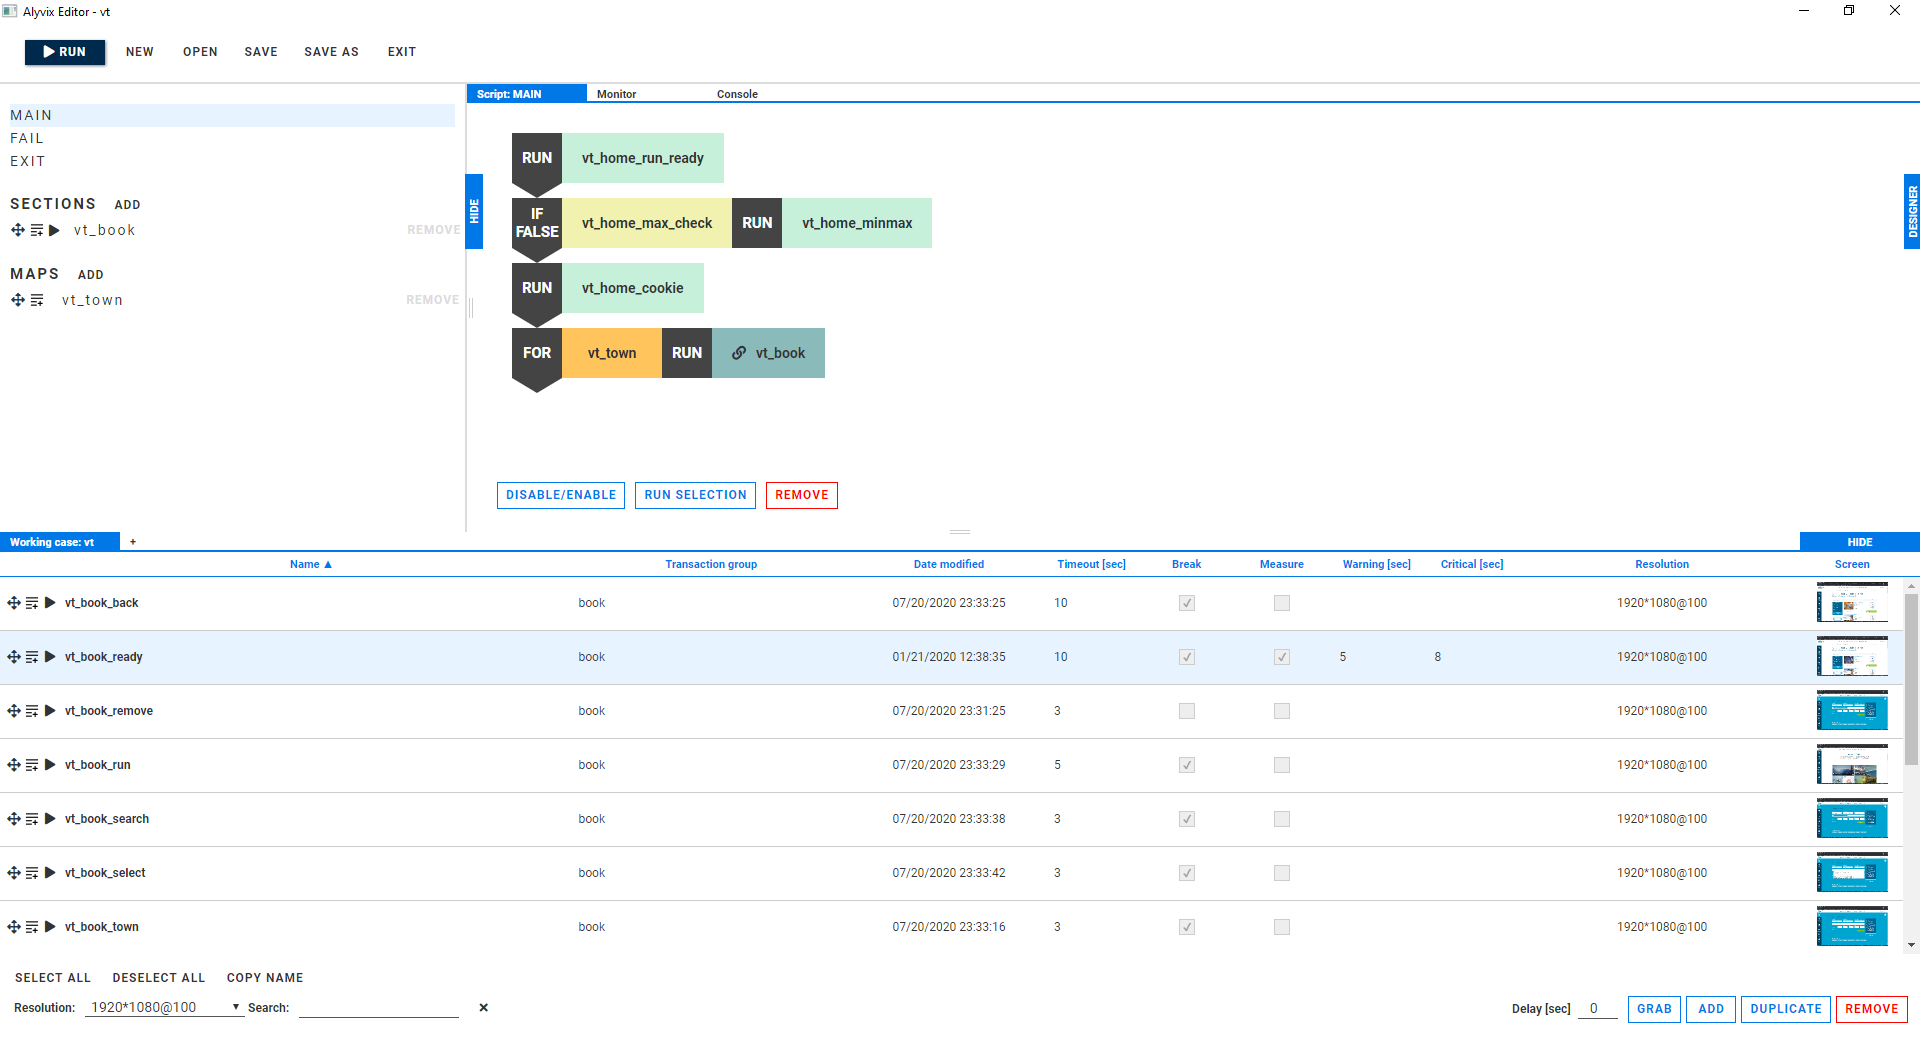
Test Case Building
Having created the task steps, you can drag and drop them into the scripting panel in order to compose the desired end-user workflow, creating an Alyvix test case consisting of a sequence of visual transactions which can be used for visual, synthetic monitoring. Conditionals and loops help implement more complex logic.
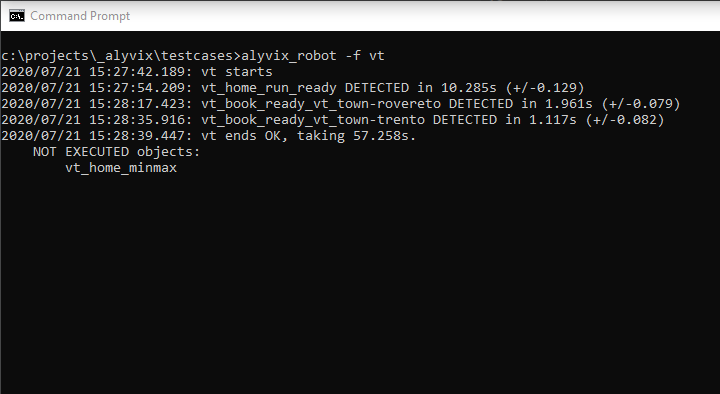
Test Case Execution
The Alyvix Robot command line tool runs the .alyvix visual test cases you've saved: this command executes pre-recorded end-user bots that reproduce your users' workflows directly on their applications. The resulting performance measurements of those interactions are displayed both in the CLI and saved as human readable output files, containing annotated screenshots that provide demonstrable and indisputable proof whenever a test case can't be run to completion.
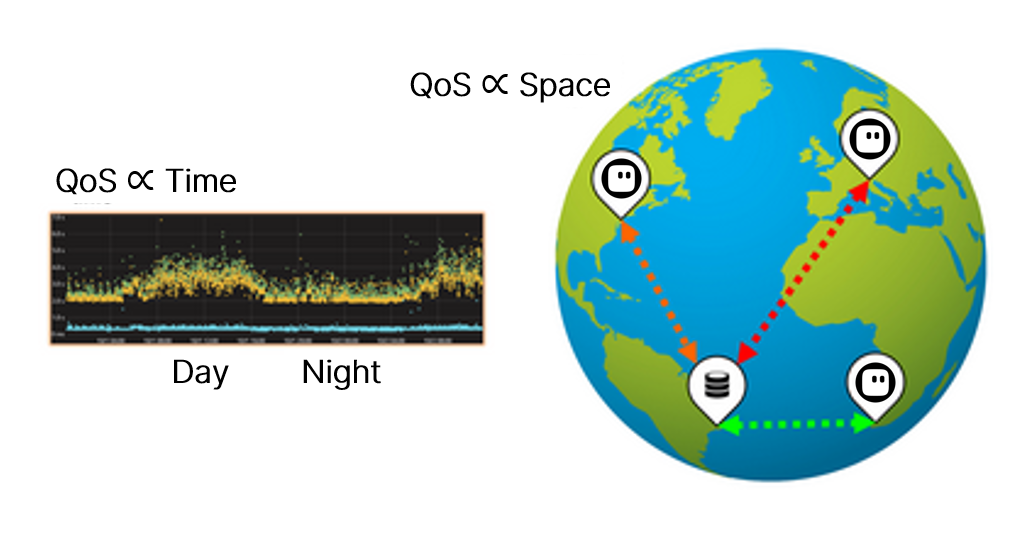
Application Monitoring
The end goal is to visualize trends over time with dashboards showing your end-user workflow performance. The data for this is drawn from the measurements of regularly and continuously scheduled test cases, and their output can be integrated into your own monitoring system, allowing you to analyze latency and downtime to assess both instantaneous and trending IT service quality. Contact us if you need support in building test cases, their integration, analysis or maintenance.